
01-09-2019, 11:59 AM
|
|
Junior Member
|
|
تاريخ التسجيل: Jan 2019
المشاركات: 13
|
|
 Simple and profitable trading style
First and fore most am not introducing any indicator or Holy Grail in trading. Am introducing a possible where and how you can catch a strong trend- for those who love trending market. Trending market is really easy to trade when you are able to catch the trend at the beginning. I have been backtesting this strategy for a quite a while now, with "Seven" platforms. This is to avoid overtrading by placing all the pairs that met the entry point on one platform. I skipped some also, though I have them in my journal as if I took them. Overtrading would have mess up my backtesting. My major reason for backtesting and checking/study the old charts is the fact that if we are able to catch trend at the beginning, getting hit by retracement will be minimized. Also we would be able to trade profitable no matter the size of the account.
1. The method works best on daily and longer time frames, because there is so much noise on the shorter time frames. I tried on 4hrs only ones, it failed me, though I don't trade 4hrs and other shorter time frames.
2. It works also when market has been moving sideways and it's about breaking out of it. I will post charts to give you a clear picture.
3. It's good for swing and position traders.
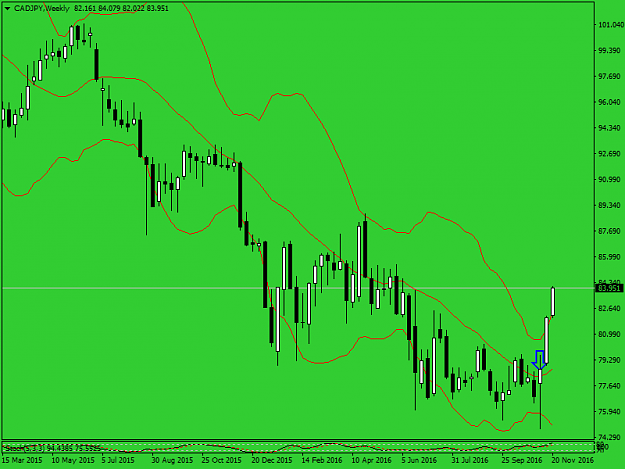
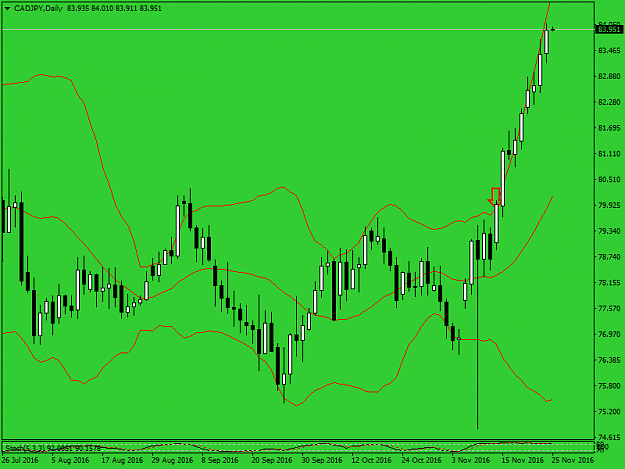
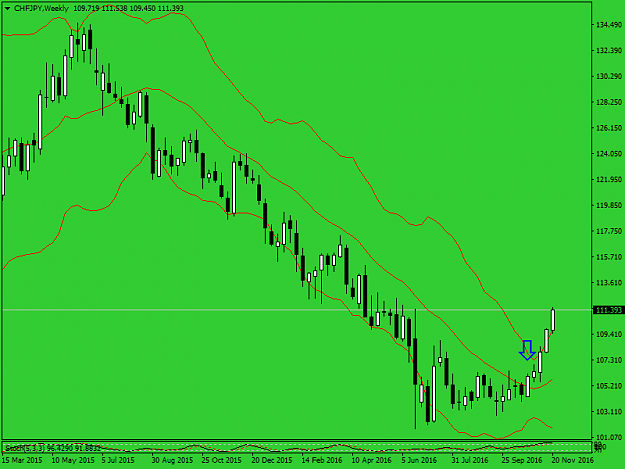
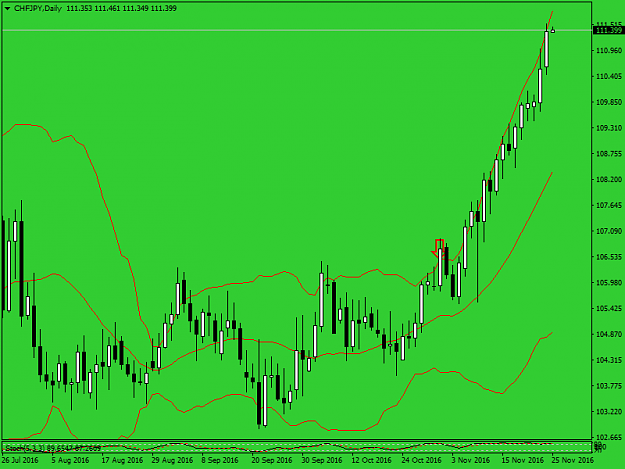
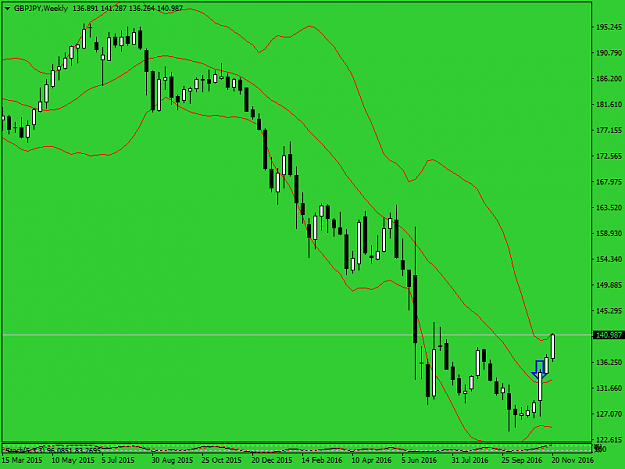
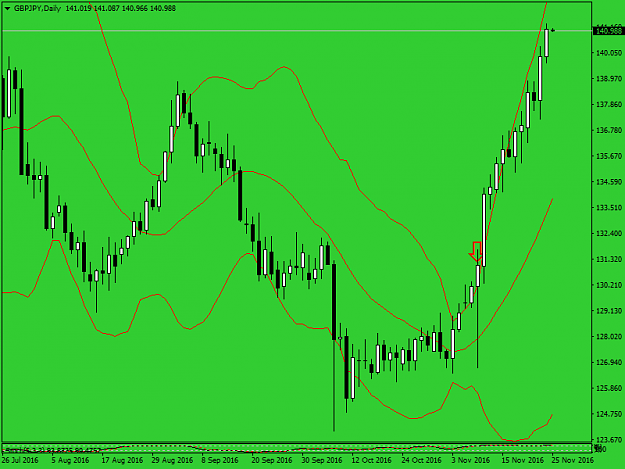
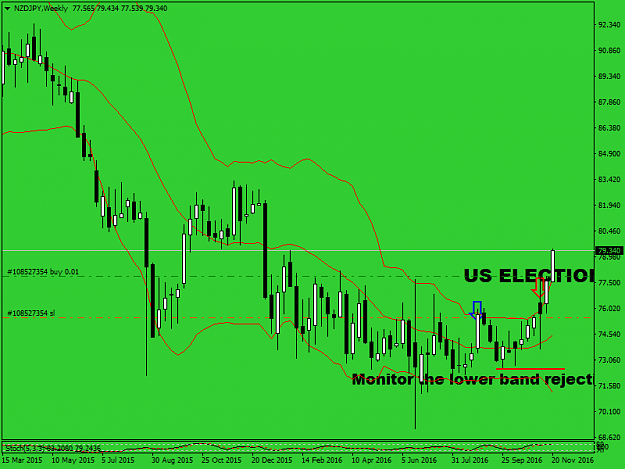
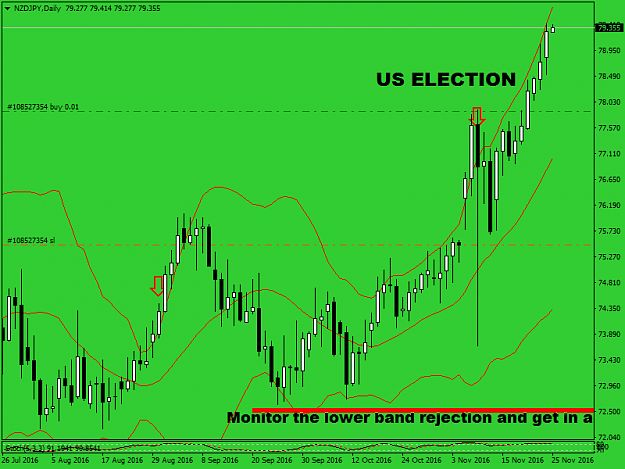
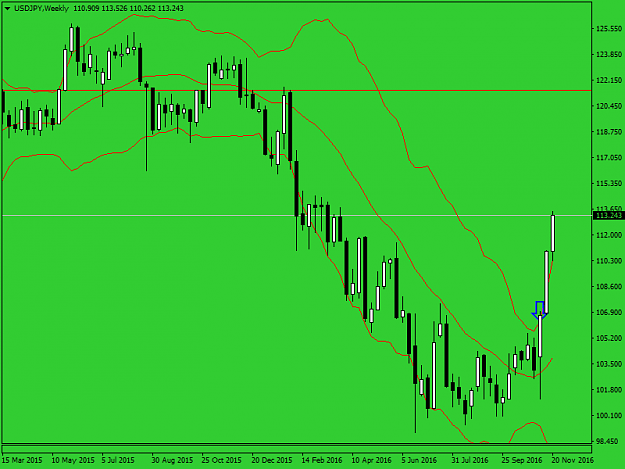
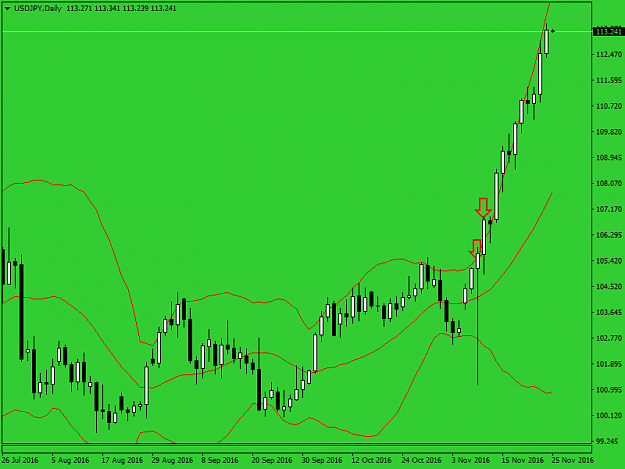
The indicator am using is none other than one of the indicators professional traders have been using profitably - Bollinger Bands. For those who're already using Bollinger Bands, it would be much easier, I feel so . If you like to use it it's easy to learn. When market shows some kind exhaustion/sideways we have to be patient and know that a big move is on the way. Monitor both the weekly and the daily charts. When weekly is strongly closing/has closed above the Bollinger Middle Band and at the same time a bullish candle candles closes above Upper Band, then there is the opportunity to start bullish trade. Reverse is the case with bearish trading. For bearish trading, when candle closes/has closed below Middle band on the weekly and first candle that closes below Lower Band on the daily shows that bearish movement has started. If the weekly strongly closed above Middle Band and the daily has not been able to close above Upper Band,there is no need to get in yet. You have to be patient. There are exceptional cases please. You would see in USDJPY long - while the weekly closed above Middle Band the daily candles were still around below upper band, until the first closed above upper band on the daily chart, then you get in. Also in my first entry on NZDJPY my SL was triggered. Even though the SL was triggered by retracement, I knew that uptrend has started. No problem. You would see on the NZDJPY chart where I monitor Bollinger Lower Band rejection to get in again. I closed it before the US election. Then I got in again. When SL is triggered don't worry, uptrend has started.
Attached Images (click to enlarge) . If you like to use it it's easy to learn. When market shows some kind exhaustion/sideways we have to be patient and know that a big move is on the way. Monitor both the weekly and the daily charts. When weekly is strongly closing/has closed above the Bollinger Middle Band and at the same time a bullish candle candles closes above Upper Band, then there is the opportunity to start bullish trade. Reverse is the case with bearish trading. For bearish trading, when candle closes/has closed below Middle band on the weekly and first candle that closes below Lower Band on the daily shows that bearish movement has started. If the weekly strongly closed above Middle Band and the daily has not been able to close above Upper Band,there is no need to get in yet. You have to be patient. There are exceptional cases please. You would see in USDJPY long - while the weekly closed above Middle Band the daily candles were still around below upper band, until the first closed above upper band on the daily chart, then you get in. Also in my first entry on NZDJPY my SL was triggered. Even though the SL was triggered by retracement, I knew that uptrend has started. No problem. You would see on the NZDJPY chart where I monitor Bollinger Lower Band rejection to get in again. I closed it before the US election. Then I got in again. When SL is triggered don't worry, uptrend has started.
Attached Images (click to enlarge)

|